Data Science is not only about programming, coding, or working with advanced technology. To understand data, identify meaningful patterns, evaluate uncertainty, and make informed decisions, students also need a strong quantitative foundation. This is why statistics for data science plays an important role in building the analytical skills required throughout a Data Science learning journey. In the edept × Mahindra University × Illinois Tech Global Pathway Program, Statistics & Probability for Analytics is included in the India Track at Mahindra University. It forms part of the six-month foundational and applied learning phase, alongside Programming for Data Science (Python), Data Management & SQL, Data Visualisation & Business, and Introduction to Machine Learning. The importance of statistics for data science also extends beyond the initial foundation. Students progress from the India phase to the Illinois Tech MAS in Data Science, where the curriculum moves into advanced areas such as Advanced Machine Learning, Artificial Intelligence Foundations, Big Data Analytics, and Data Engineering & High-Performance Computing. Understanding statistics and probability, therefore, helps connect the different stages of the program, giving students a quantitative foundation for working with data and progressing toward more advanced Data Science concepts.
What Are Statistics and Probability in Data Science?
Statistics and probability are closely connected, but they answer different questions when working with data. Statistics for data science focuses on collecting, summarising, analysing, and interpreting data to understand what the available information shows. Probability, on the other hand, focuses on uncertainty and helps us reason about the likelihood of different outcomes. Both are important because real-world datasets are rarely clear or predictable. Data can contain variation, incomplete information, unexpected patterns, or uncertain outcomes. Statistical reasoning helps students understand the evidence within the data, while probability provides a framework for thinking about what might happen next. Together, these concepts provide an important quantitative foundation for analytics and other areas of Data Science. In the MAS in Data Science Global Pathway, this foundation is introduced through the Statistics & Probability for Analytics subject in the India Track at Mahindra University.
Statistics: Understanding What the Data Tells You
Statistics helps students make sense of the information contained in a dataset. It can be used to identify patterns and variation, summarise observations, and interpret relationships within the available data. Instead of simply looking at numbers, students learn to use data as evidence for analytical conclusions. This makes statistics for data science particularly relevant to analytics and data-driven decision-making. A strong statistical foundation helps students approach datasets systematically and understand what the available information can—and cannot—tell them. In the Global Pathway, Statistics & Probability for Analytics is positioned alongside programming, SQL, visualisation, and machine learning foundations, making it part of a broader Data Science skill set.
Probability: Understanding Uncertainty
Probability addresses a different but complementary aspect of data: uncertainty. When an outcome is not completely predictable, probability provides a framework for reasoning about the possible results and their likelihood. For Data Science students, this way of thinking is useful when dealing with real-world problems where outcomes cannot always be known in advance. Probability, therefore, complements statistical analysis by helping students reason about uncertainty rather than treating every dataset or outcome as completely certain. This foundation can support later learning in areas such as machine learning and advanced Data Science, where students work with patterns, predictions, and data-driven models.
Why Do Data Science Students Need Statistics and Probability?
A strong foundation in statistics for data science helps students move beyond simply processing data to understanding what the data actually means. Data Science involves working with information that can vary significantly across datasets, so students need quantitative reasoning to identify patterns, evaluate evidence, and make informed conclusions. Statistics and probability provide complementary skills for this process.
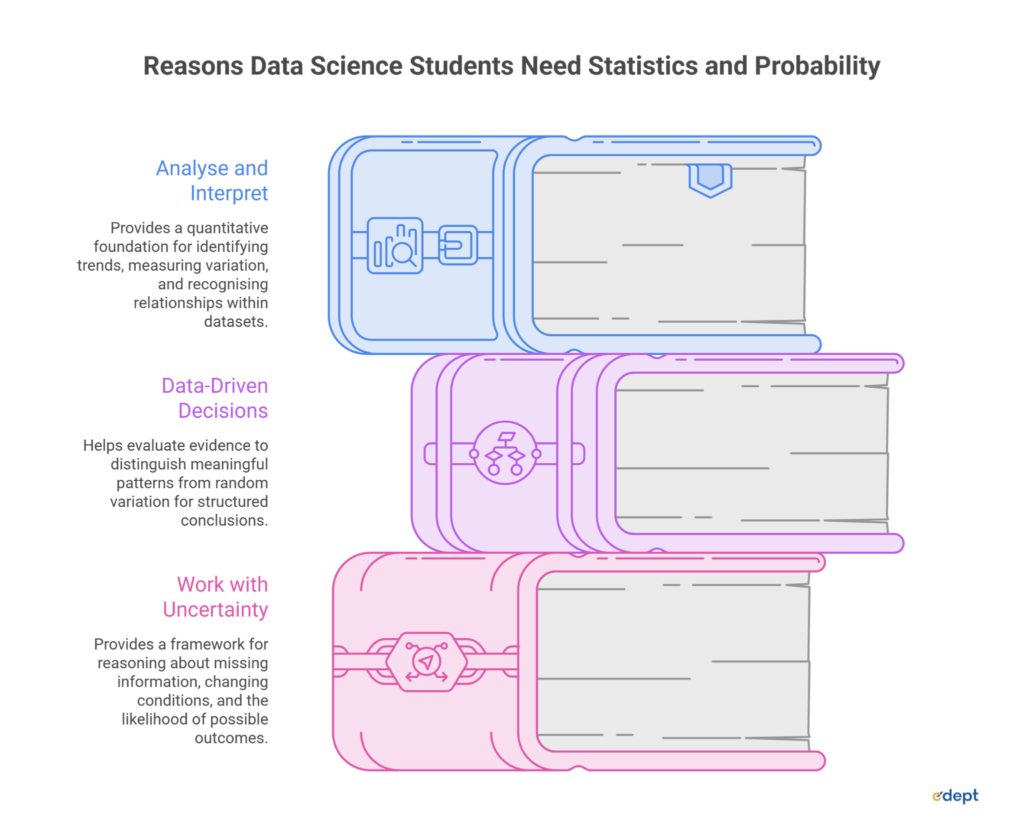
To Analyse and Interpret Data
Data Science starts with understanding the data available. Statistics provides a quantitative foundation for identifying trends, measuring variation, and recognising relationships within datasets. This allows students to move from raw information toward useful analytical insights. For example, statistical thinking can help a student determine whether a pattern in a dataset is meaningful or simply reflects normal variation. This becomes particularly relevant when working with analytics, where interpreting data correctly is essential to making sound conclusions. In the Global Pathway, the Statistics & Probability for Analytics subject provides part of this foundation during the India Track at Mahindra University.
To Make Data-Driven Decisions
Data is valuable when it can support better decisions. Statistical reasoning helps students evaluate evidence rather than relying only on assumptions or isolated observations. It can help distinguish meaningful patterns from random variation and provide a more structured basis for concluding. This connects with the broader role of Data Science in business and professional settings. The program’s curriculum combines statistics with Data Visualisation & Business, machine learning, programming, and applied projects, creating a connected foundation for using data in practical contexts.
To Work with Uncertainty
Real-world data is rarely completely certain or predictable. Missing information, changing conditions, and different possible outcomes are common in data-driven problems. Probability provides a framework for reasoning about this uncertainty and considering the likelihood of possible outcomes. This way of thinking can establish a foundation for predictive and analytical approaches introduced later in a Data Science learning journey. In the Global Pathway, students progress from foundational subjects in India to advanced areas such as Advanced Machine Learning and Big Data Analytics at Illinois Tech.
How Statistics Supports Machine Learning
Statistics for data science is not a concept that ends after completing one subject. It provides an important quantitative foundation for understanding how data behaves and how patterns can be interpreted. As students progress through a Data Science curriculum, this foundation becomes relevant to increasingly advanced areas, including Machine Learning. The MAS Global Pathway follows this progression deliberately. In the India Track, students study Statistics & Probability for Analytics before moving to Introduction to Machine Learning. During the USA Track at Illinois Tech, the curriculum advances further into Advanced Machine Learning.
From Statistical Understanding to Machine Learning
The progression begins with understanding data, its relationships, and the variation within it. Students can then move toward Machine Learning approaches that use data to identify patterns and support analytical or predictive tasks. This is where statistics for data science becomes particularly valuable. Statistical understanding gives students a way to think about the data underlying a model rather than approaching Machine Learning as an isolated collection of techniques. As students move from introductory Machine Learning toward advanced concepts, their earlier quantitative foundation provides useful context for understanding how models work with data. The pathway, therefore, connects foundational quantitative learning in India with advanced Machine Learning study in the USA rather than treating these subjects as unrelated topics.
Why a Strong Quantitative Foundation Matters
Advanced Data Science involves more than running a model and accepting its output. Students need to develop the ability to interpret results, question patterns, and understand what the underlying data may indicate. Quantitative reasoning supports this analytical approach. A strong foundation in statistics for data science can therefore help students engage with Machine Learning concepts more thoughtfully instead of treating models as black boxes. It strengthens the connection between data, analytical reasoning, and model-based learning In the Global Pathway, this progression continues from the India Track’s foundational and applied learning to the Illinois Tech MAS curriculum, which includes Advanced Machine Learning alongside Artificial Intelligence Foundations, Big Data Analytics, and other advanced subjects.
The Role of Statistics and Probability in the MAS in Data Science Curriculum
In the MAS in Data Science Global Pathway, statistics for data science is positioned as part of the academic foundation rather than as an isolated subject. The India Track combines Statistics & Probability for Analytics with Programming for Data Science (Python), Data Management & SQL, Data Visualisation & Business, Introduction to Machine Learning, Cloud & Data Infrastructure Fundamentals, and Applied Projects & Assessments. This combination is important because Data Science requires students to work across different stages of the data lifecycle. Programming provides the technical foundation for working with data, while statistics and probability help students analyse and interpret it. SQL, visualisation, and machine learning then build on these complementary skills.
Statistics as Part of the India Track Foundation
The six-month India phase at Mahindra University is designed around foundational and applied Data Science learning. During this stage, Statistics & Probability for Analytics sits alongside programming, data management, visualisation, and introductory Machine Learning. This means statistics for data science forms part of a broader academic foundation before students progress to the U.S. phase. Rather than treating quantitative concepts separately from technical learning, the curriculum places them within a connected set of subjects that prepares students for more advanced Data Science study.
Connecting the Foundation to the Illinois Tech Track
After completing the India phase, students progress to the Illinois Tech MAS in Data Science in Chicago. The USA Track moves into advanced subjects including Advanced Machine Learning, Artificial Intelligence Foundations, Big Data Analytics, Data Engineering & High-Performance Computing, Data Strategy & Governance, and a Capstone Project or Master’s Thesis. The quantitative foundation developed during the India Track therefore fits into a larger academic progression. Statistics for data science helps students build the analytical perspective needed to engage with increasingly advanced Data Science concepts, while programming, data management, and machine learning provide complementary technical foundations.
How Statistics and Probability Are Used Across Data Science
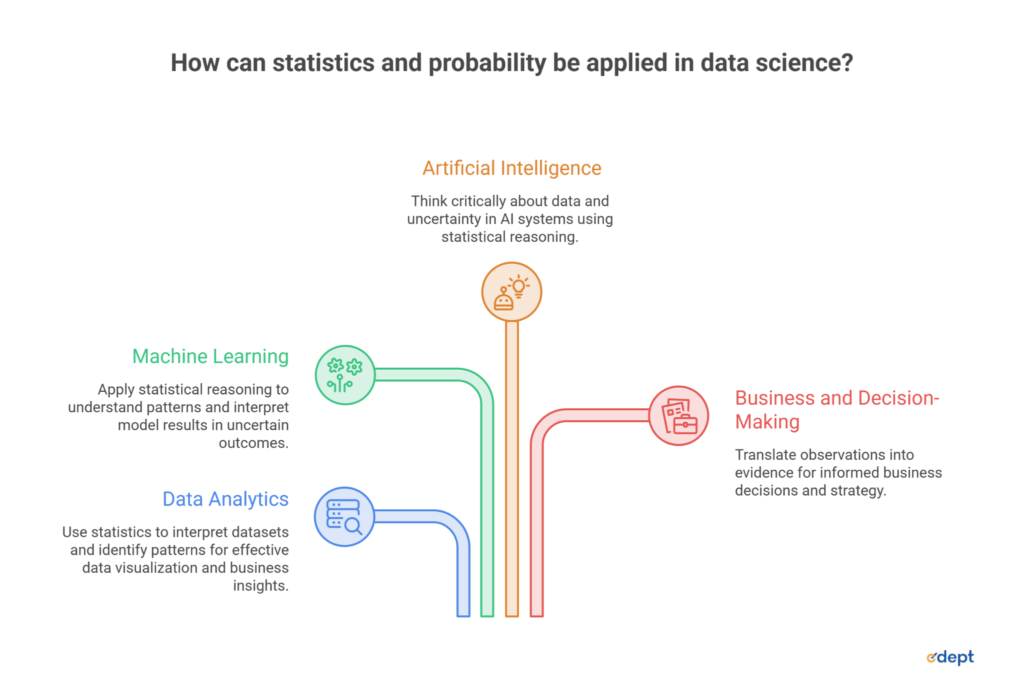
The importance of statistics for data science extends across several areas of the field. In the MAS in Data Science Global Pathway, these concepts connect with analytics, Machine Learning, Artificial Intelligence, and business-focused decision-making.
Data Analytics
Statistics helps students interpret datasets, identify meaningful patterns, and use evidence to support analytical conclusions. This connects directly with the program’s Data Visualisation & Business component, where understanding information is important for communicating insights in a practical context.
Machine Learning
Machine Learning involves finding patterns in data and working with outcomes that may not always be certain. Statistical reasoning can help students understand these patterns and develop a more informed perspective when interpreting model-related results. The pathway introduces Introduction to Machine Learning in India before progressing to Advanced Machine Learning at Illinois Tech.
Artificial Intelligence
Statistical reasoning can also contribute to understanding data-driven AI systems by helping students think critically about the data and uncertainty involved. In the pathway, Artificial Intelligence Foundations appears as an advanced subject in the Illinois Tech USA Track, following the foundational learning completed in India.
Business and Decision-Making
Ultimately, data is used to inform decisions. Statistics helps translate observations into evidence that can be interpreted within a business context. This connects with Data Visualisation & Business in the India Track and Data Strategy & Governance in the Illinois Tech curriculum. Together, these areas show how statistics for data science can support the journey from understanding data to applying it in analytical and business settings.
How Learning Statistics and Probability Can Support Data Science Career Paths
The value of statistics for data science extends into several career paths where professionals work with data, patterns, analytics, and decision-making. The MAS in Data Science program highlights roles including Data Scientist, Senior Data Analyst, Machine Learning Engineer, Product & Growth Analyst, and Business Analytics Manager.
Data Scientist and Machine Learning Engineer
Data Scientists and Machine Learning Engineers work extensively with data and models. Statistical reasoning can help professionals analyse patterns, interpret quantitative information, and understand the data underlying Machine Learning approaches. This connects with the pathway’s progression from Statistics & Probability for Analytics and Introduction to Machine Learning in India to Advanced Machine Learning at Illinois Tech.
Data Analyst and Business Analytics Roles
For Data Analysts and Business Analytics Managers, the ability to interpret datasets and identify useful patterns is central to analytical work. Statistics can support this process by helping professionals evaluate information and draw evidence-based conclusions. These skills connect naturally with areas such as data visualisation and business-focused analytics, both represented in the program curriculum.
Product & Growth Analytics
Product & Growth Analysts work with behavioural and business data to understand patterns that can inform product and growth decisions. Statistics for data science can provide a quantitative perspective for interpreting these patterns and evaluating what the available data suggests. These career paths demonstrate why statistics and probability form an important part of the broader Data Science foundation. They complement programming, Machine Learning, visualisation, and business knowledge rather than functioning as an isolated skill.
Statistics and Probability vs. Programming in Data Science
A common misconception is that Data Science is primarily a coding discipline. In reality, statistics for data science and programming serve different but complementary purposes. Programming helps students work with data and implement solutions, while statistics helps them understand, interpret, and reason about the information within that data.
Programming Helps You Work With Data
Programming provides the technical ability to access, process, and work with datasets. In the Global Pathway, Programming for Data Science (Python) is included in the India Track alongside Statistics & Probability for Analytics. Python therefore gives students a practical way to work with data and implement Data Science solutions. It forms one part of the technical foundation needed to progress through the curriculum.
Statistics Helps You Understand the Data
While programming helps students manipulate and process data, statistical reasoning helps them understand what the data means. It supports the interpretation of patterns, variation, relationships, and evidence within datasets. This distinction is important because producing an output from data is not the same as understanding that output. Statistics for data science provides the quantitative perspective needed to evaluate and interpret information rather than relying only on computational results.
Why Both Are Included in the Curriculum
The curriculum brings these skills together. Python, Statistics & Probability, Data Management & SQL, Data Visualisation & Business, and Introduction to Machine Learning form a connected foundation during the India Track. This combination shows why Data Science is not treated as purely a coding discipline. Programming provides the tools to work with data, while statistics provides the reasoning needed to understand it. Together, they create a stronger foundation for progressing toward advanced Data Science subjects at Illinois Tech.
Build Your Data Science Foundation with the MAS Global Pathway
Statistics and probability provide an important quantitative foundation for understanding data, analysing patterns, and working with uncertainty. In the edept × Mahindra University × Illinois Tech Global Pathway, students develop this foundation during the six-month India Track before progressing to advanced Data Science study in the USA. The India Track combines Statistics & Probability for Analytics with Python programming, SQL, data visualisation, and Introduction to Machine Learning. Students then progress to the Illinois Tech MAS in Data Science, where the curriculum advances into areas such as Advanced Machine Learning, Artificial Intelligence Foundations, Big Data Analytics, and Data Engineering. This progression demonstrates why statistics for data science should not be viewed separately from programming or Machine Learning. Programming gives students the ability to work with data, statistics helps them interpret it, analytics connects insights to practical contexts, and Machine Learning builds on the ability to recognise patterns and reason quantitatively. If you are looking to develop these skills through a structured India-to-USA academic pathway, explore the edept × Mahindra University × Illinois Tech MAS in Data Science Global Pathway Program and understand how its foundation-to-advanced curriculum can fit your Data Science learning journey.