Excel vs Power BI? Power BI is generally better than Excel for interactive data visualization, handling large datasets, and automated reporting, while Excel excels at ad-hoc analysis, small-scale modeling, and detailed data entry.
If you are planning to build a career in data, one question will inevitably come up: Excel vs Power BI; which tool should you learn first?
In today’s digital world, companies are hugely dependent on data. They always look for professionals who understand data and can derive meaningful insights for improved decision-making. When it comes to data analysis, visualization, and reporting, the two most powerful tools that dominate the industry are Excel and Power BI. They play a very important role in today’s data-driven environment. Microsoft Excel has been the main office tool for nearly 30 years. Companies use it daily for day-to-day work, calculations, data entry, and creating graphs and charts, as well as small reports.
On the other hand, Power BI is almost reaching 10 years, and it is a very advanced tool with modern features. It is mainly used for advanced data analysis, visualization, and reporting. It helps in creating beautiful and meaningful dashboards from which we can easily derive actionable insights.
So now the real question is, if you really want to invest your precious time into learning a new skill, which one should you learn? Should you first build your foundation in Excel and then start with Power BI, or just jump-start with Power BI? The answer is completely dependent on where you are in your career at present, what kind of job you do, and where you want to see yourself in the near future. In this guide, we will walk you through all the details about Excel vs Power BI tools and how they can help you in shaping your career path.
Read More : Is Data Science a High Paying Job in India
What is Excel?
Microsoft Excel is a very powerful spreadsheet application that has been a part of the Microsoft suite since 1985. It is widely used to analyse, organize, and store data for financial analysis, budgeting, data visualization, and task management. Moreover, it organizes data in the form of rows and columns on a grid-like structure, with each intersection commonly called a ‘cell’. This helps users to handle a large set of information quickly. Excel is best for data entry, calculations, data cleaning, basic simple charts, small reports, and daily office work.
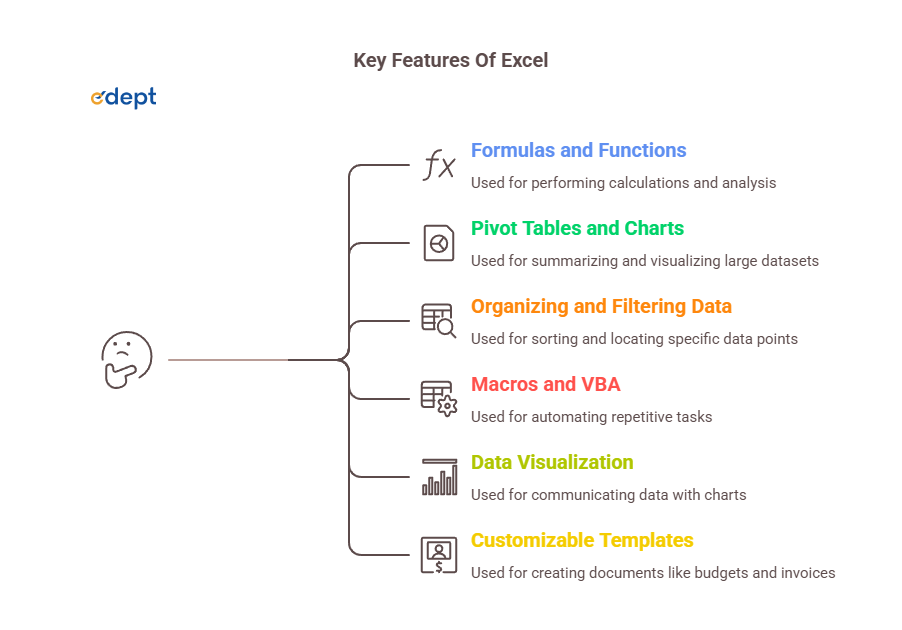
Key Features of Excel
Some of the key features of Excel include:
- Formulas and functions: They help in performing calculations by combining a cell reference with the mathematical operators. They perform automatic calculations, usually ranging from basic to complex analysis using SUM, VLOOKUP, INDEX MATCH, and IF statements.
- Pivot Tables and Charts: They help in summarising large amounts of data, which allows for quick data analysis and visualization.
- Organizing and filtering data: It helps in sorting, filtering, and structuring information efficiently to locate specific data points quickly.
- Macros and VBA: It helps in automating repetitive tasks using programming or by recording actions.
- Data Visualization: Here, users can communicate their data using various charts, which are available in Excel, such as bar charts, line charts, etc. These charts also allow formatting options for customization, such as using colours and labelling for better appeal.
- Customizable Templates: Excel provides a large library of ready-made templates for creating budgets, invoices, and scheduling.
When to Use Excel?
Excel is best used in organizing, analyzing, visualizing, and performing calculations with data. It helps in creating financial models, forecasting, and creating budget plans. It is also useful in performing data analysis and calculations. It helps in creating reports and dashboards. It is useful in creating charts and graphs to clearly present data. It sometimes helps in managing simple lists, which include CRM data, client lists, and inventory data.
Pros and Cons of Excel
Some of the key advantages include:
- Microsoft Excel is widely known and universally accepted
- It is very easy for beginners to learn Excel and utilize it in their daily tasks.
- It helps in filtering, sorting, and cleaning a large amount of data to derive meaningful insights
- It is very useful in creating charts, graphs, and dashboards for a better presentation of data
- It is very flexible and customizable
- It supports powerful formulas and functions that help in solving critical problems.
Some of the key disadvantages are:
- There is a high risk of human error in Excel. Discovering these errors can be very difficult.
- Excel can not deal with a large amount of data.
- Excel files are not always well protected, and there is a high risk of data loss and theft
- Here, we need manual updates, which are not very useful for live data
- The software requires a paid version, and it is not free.
What is Power BI?
Power BI is a business intelligence tool that was developed by Microsoft. It was launched in 2013 and was widely available from 2015. It is mainly designed to transform raw data into meaningful, actionable insights. It helps users in creating interactive reports and dashboards. It also helps in visualizing data, identifying the latest trends, and finally making data-driven decisions, without any advanced knowledge of coding. Power BI is best for large analyses of data, creating interactive dashboards, data modelling, automated reports, and connecting multiple data sources.
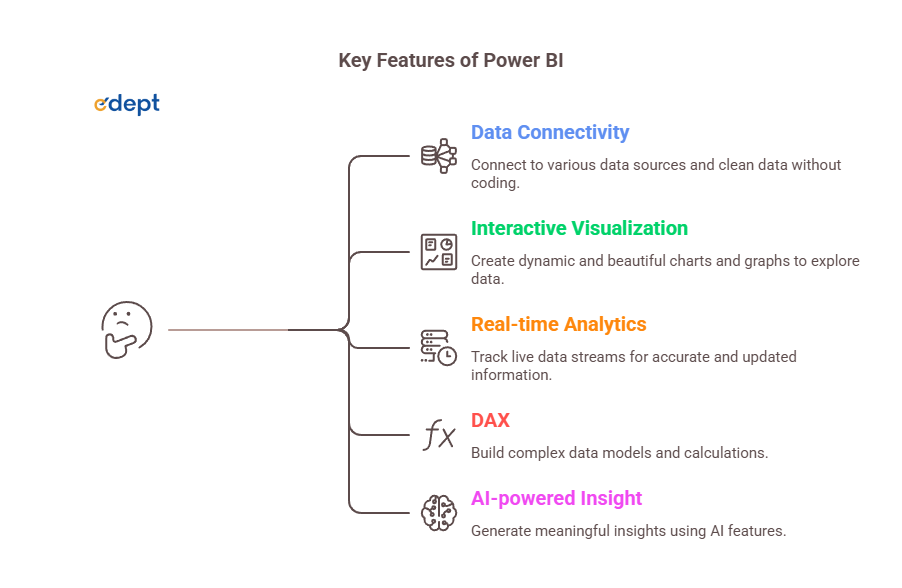
Key Features of Power BI
Some of the key features of Power BI are:
Data Connectivity: It helps in connecting various data sources, including databases, spreadsheets, cloud services, etc. It also uses Power Query to clean data without any advanced coding knowledge.
Interactive and Beautiful Visualization: One of the key features of Power BI is creating interactive, dynamic, and beautiful visualizations. It offers a wide variety of well-customized charts, graphs, and maps to explore data more deeply
Real-time analytics: It offers various support for live streaming of information; it helps in keeping track of changes that are occurring currently. Hence, it is very useful when we need accurate and updated information
DAX (Data Analysis Expression): It helps in creating complex data models and complicated calculations using DAX.
AI-powered insight: It uses some inbuilt AI features such as natural language, forecasting and predicting, and Q&A, and finally generates meaningful insights
When to Use Power BI?
Power BI is a business intelligence tool that is mainly used for advanced data analysis. When you are working with a large amount of data, it becomes very difficult to handle; in that case, Power BI helps in managing such data. It offers various support for live streaming of information; hence, when you need an updated report, you can get it very easily from the live sources. When your reports need to be shared with many people across various departments, Power BI is very helpful for handling such situations. When you need to transform data into interactive reports, charts, and dashboards, you can easily do it with the help of Power BI.
Pros and Cons of Power BI
Some of the advantages of Power BI are:
- It is very cost-effective and affordable
- It provides integration effortlessly with the Microsoft ecosystem
- It provides a wide data connectivity
- It provides complex data modelling, calculations, and transformation using DAX
- It helps in creating interactive and beautiful dashboards
- It offers various support for the live streaming of information
Some of the disadvantages are:
- It provides a very steep learning curve
- It can sometimes crash or hang when handling a large amount of data
- It has very poor support for non-Microsoft environments.
- It provides good visuals, but with proper technical expertise,
- It has a very limited offline capacity
Also, Check : Top 10 Data Analytics Tools for Beginners
Difference Between Power BI vs Excel
Now let’s find out about the real difference between Power BI or Excel. While both tools are from the Microsoft suite, they actually serve different purposes. Understanding both of these tools will help you decide which one matches your career path.
Learning Curve
Excel is much more familiar to learners. Many people have used Excel in their schools, colleges, and even in their early careers. The basic concepts of Excel are very easy to understand, and it takes only a few days to learn them. The interface is very familiar; the functions applied are logical, and most importantly, there are endless tutorial videos available on YouTube, as well as various free courses to master Excel.
On the other hand, Power BI is a new concept that is a bit less intuitive for new learners. It involves new techniques and concepts such as data modelling, data visualization, and DAX formulas. All of these require a bit of a different type of thinking, but it is not impossible to learn; it just takes a bit of your dedicated time and effort. People who have experience in Excel often find Power BI significantly easier.
Flexibility
In flexibility, Excel wins very easily. You can utilize a single spreadsheet any way you want it to be. You can store data, you can perform calculations, you can add text and images, and you can apply formulas and filters. Along with it, you can generate reports and create charts. It is a very flexible platform and easy to use.
Power BI is more complex than Excel. It handles a large amount of data and visualizes data from various data sources. It helps in creating detailed dashboards and charts. Here, you can not just add a very random text or image just next to a chart, nor can you use it as a budget calculator. It follows a certain consistency; it is not a general-purpose tool.
Data size & Model Complexity
In Excel, you cannot run a large amount of data. It has a limit of approximately 1.4 million rows per sheet. It may look like a lot of data, but when you are working with large client databases, server logs, and transactional data, these limits fill up very quickly. Once they reach beyond the limit, the results start degrading and become slow.
On the other hand, Power BI handles large amounts of data very efficiently. It has a built-in memory compression engine commonly called ‘Vertipaq’, which can handle millions of data points without crashing. If you are working with a lot of data sets and databases, then Power BI is the right option for you
Cloud-based Features & Accessibility
Microsoft Excel is basically a desktop application. Although Microsoft 365 has brought some online features, it has very limited functionality.
Power BI was primarily built for cloud computing and sharing. When you create a report in Power BI, and you want to share it with your team, you can easily do so by publishing the report in Power BI services. Anyone who has access permission can easily check out the reports, which are shared by you. With the Power BI mobile application, you can easily check the dashboards and reports anywhere in the world.
Visualization Options
Excel offers a standard set of charts and graphs, which includes bar, pie, line, column, and a few other types of charts. They are functional but static in nature.
Power BI is famous for its visualization. It offers a wide variety of custom visuals, templates, interactive visuals, and heatmaps from its marketplace. Each and every chart is interactive in nature; you just click once, and you get detailed and structured information.
Chart Interactivity
In Excel, charts are normally images that reflect your data. They usually update when data changes. They are mostly limited to filters and slicers. Here, you cannot just click on a bar chart and check the rest of the dashboard automatically adjust.
In Power BI, every visual on a reporting page is connected to the others. They provide beautiful and interactive charts and set up tooltips, bookmarks, and cross filters, thus creating a detailed analytical experience for the user. Here, you just click on a bar chart and check that the rest of the dashboard automatically adjusts.
Cost
Excel usually comes with a Microsoft 365 subscription, which most of the organizations have. It costs nearly $159.9 per user.
Power BI Desktop is completely free to use and download. However, if you want to share reports with others, it generally requires a Pro licence of $13.70 per user every month.
Data Security
Excel files provide very limited security. You can create a password for your workbook, but it is a very basic layer of protection. There is not too much built-in control for protecting your data.
Power BI provides very high, enterprise-grade security. It has role-level security, which sets up rules that provide only authorized people access to your shared files. With Microsoft Cloud Security standards, Power BI is more trustworthy and robust than Excel.
Also, check – Why Storytelling with Data is a Vital Skill in Business Analytics
Excel vs Power BI Comparison Table
Below is the clear distinction between Excel vs Power BI:
| Feature | Excel | Power BI |
| Purpose | Manual updates are required | Data visualization and business intelligence |
| Ease of Use | It is beginner-friendly and widely known | Requires some learning curve, especially DAX |
| Data Handling | Suitable for smaller datasets, up to 1 million rows per sheet | Suitable for large data sets. Millions of rows pr sheet |
| Data Visualization | Basic graphs and charts | Advanced and interactive dashboards and reports |
| Automation | Macros and VBA | Automatic refresh and updates. AI-driven insights |
| Real-time Data | Analyst, finance team, and individual user | Real-time live data support |
| Data Sources | Spreadsheets, CSV, SQL Server | 100+ connectors, a broad range of data integrations |
| Performance | It slows with large files | It is built for handling large volume of data |
| Collaboration | Provides real-time collaboration in Office 365 | Real-time collaboration and sharing using cloud services |
| Cost | Part of the Microsoft Office suite | Separate licensing or subscription |
| Security | Basic password protection | Row-level security, Azure AD integration |
| Best For | Analyst, finance team and individual user | Enterprise reporting, dashboards, |
What Are the Advantages of Excel?
Some of the key advantages of Excel are:
- It provides easy data storage and organization. It allows storing information easily in an organized way in rows and columns. It helps in keeping data such as inventory and customer billing in a very structured way.
- It provides powerful data analysis and visualization. Tools such as pivot tables, charts, and graphs turn raw data into meaningful insights
- Efficient calculation is performed with the help of Excel. It has some built-in formulas and functions, which allow rapid mathematical calculations, faster and more accurately.
- It is universally familiar and well accepted. Every single person has used Excel at least once in their life, be it in school, college, or their early career. Sharing an Excel file requires no special permissions.
- No technical background is required to start using Excel. It is beginner-friendly and easy to use.
- It has a strong VBA ecosystem. For professionals who love to code, it opens a new world of automation with Excel.
- You can work offline in Excel; it functions perfectly on your local machine.
What Are the Advantages of Power BI?
Some of the advantages of Power BI are:
- It provides a very smooth and seamless integration with the Microsoft ecosystem
- It provides extensive data connectivity. It connects over 100 on-premise cloud-based data sources.
- It provides very high-level data visualization and interaction. It has powerful and well-customised visuals, charts, templates, and graphs, which allow deep data exploration.
- It helps in providing live data updates; hence, it allows dashboards to reflect current information for accurate and timely decision-making.
It is a relatively low-cost and high-value tool for individuals as well as organizations - It helps beginners to create complex and sophisticated reports without any advanced programming or coding skills.
- It provides strong governance and security. Only with proper authorization will you be able to access any file shared with you. Power BI provides row-level security and Azure AD integration for protecting sensitive information and data.
What Are the Strengths and Limitations of Excel?
Some of the strengths of Excel are:
- It is ideal for formula-driven analysis, calculation, and financial modelling
- It is versatile in nature. It can be used as a planner, calculator, database, budget tracker, and report builder
- It is universally accepted and has a massive number of videos and tutorials on YouTube and other social media.
- It is very user-friendly and easy to learn. Beginners can learn Excel very easily.
Some of the limitations are:
- It can not handle a large amount of data, often crashes, and its performance degrades
- Here, version control issues arise when multiple users are modifying a file.
- The graphs and charts are not interactive and static in nature
- It is not built for real-time data or automated reporting
What Are the Strengths and limitations of Power BI?
Some of the strengths of Power BI are:
- It handles a large amount of data efficiently and solves complex issues.
- Visuals are very beautiful, interactive, and modern.
- It provides a very smooth and seamless integration with the Microsoft ecosystem.
- It provides extensive data connectivity. It connects over 100 on-premise cloud-based data sources.
- It provides very high-level data visualization and interaction. It has powerful and well-customized visuals, charts, templates, and graphs, which allow deep data exploration.
- It helps in providing live data updates; hence, it allows dashboards to reflect current information for accurate and timely decision-making.
Some of the limitations are:
- Power BI is not a general-purpose tool; you cannot just use it to build an invoice or project timeline. It is a very crucial tool.
- It provides a very steep learning curve.
- It can sometimes crash or hang when handling a large amount of data.
- It has very poor support for non-Microsoft environments.
- It provides good visuals, but with proper technical expertise.
- It has a very limited offline capacity.
Power BI or Excel: When Should You Use Each?
When to Use Excel:
- When you are trying to perform detailed data entry and management tasks, you should use Excel. It has grid-like features and interfaces that allow you to arrange, retrieve, and handle information.
- If your data set is only a few lines and you need a quick calculation, then Excel is perfect for you
- It is often used for simple data analysis and reporting. It helps in summarizing data without any complexity by utilizing pivot tables, graphs, and charts
- When you want to import and export a file easily, you can do it with the help of Excel.
- If you are working individually or with a small group of people, then Excel is the right choice
- For financial modelling or forecasting, Excel is the right choice
When to use Power BI:
- Power BI is the right choice when you are handling a large amount of data.
- If you want interactive, visually appealing reports and dashboards for your organization, then Power BI is the correct choice
- If you want a live, real-time data analysis and reporting, then you should go for Power BI
- If you have a big team and you want to collaborate with everyone and share your files, then Power BI is the best option for you
- If your analysis requires extracting data from various sources, you should use Power BI.
- If you want easy mobile accessibility to interact with your reports and dashboards, then Power BI is the right choice.
Excel vs Power BI: Which One is Better for Beginners?
For beginners who are just starting their journey, whether you are a student, a career switcher, or a college student, and who have no prior experience in data, you should start with Excel first. Excel is the best choice because it covers the basics and foundational concepts. Moreover, there are thousands of tutorials and free courses available online from which you can easily start your Excel journey. It is beginner-friendly and easy to understand. It teaches you various data concepts such as sorting, filtering, formulas, pivot tables, and basic data visualization.
You can just start with very simple, small tasks like budgeting, sorting a list, and writing a SUM formula, and then gradually move towards advanced topics such as automation and reporting. Nowadays, almost every job requires basic Excel knowledge, and if you have advanced knowledge, then it is better. The learning curve is very smooth, and you can become productive within a few days.
Read More : Is Data Analyst a Good Career in India
Which Is Better for Career Opportunities: Excel or Power BI
Both of these tools have their own specifications and offer different career opportunities. Excel is generally used for foundational tasks, which include finance, accounting, project management, etc. Knowing Excel is a basic requirement for any job, but if you are an expert in advanced Excel (data modelling, VBA, macros, complex formulas), then it can open doors for many job opportunities. Some of the most common Excel-focused roles include: Financial analyst, accountant, operations manager, MIS executive, administrative professional, and project coordinator.
Power BI, on the other hand, is important for high-growth data analytics, business intelligence, and data visualization. A Power BI specialist generally earns more than 10-40% higher salaries than Excel users, which makes it a better career choice. Demand for Power BI professionals has increased significantly as companies rely more heavily on data-driven decision-making. Some of the most common roles include data analyst, business intelligence analyst, Power BI developer, reporting analyst, and business analyst.
From a salary perspective, Power BI offers significantly higher salaries than Excel. Your smartest career move will be if you first learn the fundamentals of Excel and build your foundation, and then start adding Power BI to your profile. The transition from Excel to Power BI is very smooth and common, and it can add high value to your resume.
Kickstart Your Career in Data Analytics
Train with edept and gain hands-on skills to become a job-ready data analyst.
Can Excel and Power BI Work Together?
Yes, absolutely. Both of these tools can work together. Microsoft had built these tools so that they could complement each other.
Integration Between Excel and Power BI
- Power BI can import data from any Excel workbook. A user can easily load an Excel sheet into Power BI. This is one of the most common integration paths.
- In some cases, Excel workbooks act as data sources for Power BI dashboards or reports. When we connect Power BI with Excel, it allows users to create live reports that are updated constantly, once the connected Excel file gets refreshed
- Power BI has an inbuilt feature called Analyze in Excel’. It allows Power BI features inside MS Excel. This enables users to export data models from Power BI to pivot tables, making a very deep data analysis.
- Data models that are created in Excel with the help of Power Pivot can easily be imported into Power BI.
Workflow Example
Imagine there is a finance team whose task is to collect sales data in Excel every month. They can easily import that Excel file into Power BI and build an automated monthly sales dashboard and report, and can easily share it with the leadership teams. This is done without manually rebuilding the report each time. The Excel file acts as the data input layer, and Power BI handles the reporting. This kind of workflow is very common in organizations, and if you understand both the tools, you can easily design and operate them.
What Is the Future of Excel and Power BI?
Both these tools are rapidly evolving, and Microsoft is heavily investing in making them more capable and smarter.
AI Integration in Excel
Using Copilot in Excel, Microsoft’s AI assistant helps you write formulas, analyse data, and even generate Python code. Various functions, such as XLOOKUP, SORT, FILTER, and UNIQUE, have standardized how formulas work in Excel. Microsoft has also introduced Python integration, which allows running Python scripts inside Excel cells. Excel can now recognize various stocks, geographies, and data types, finally pulling live information from the web.
AI & Automation in Power BI
Power BI is now being enhanced with many new Copilot capabilities. It helps users to generate reports, create interactive dashboards, and create various summaries using natural language prompts. It builds and applies a machine learning model without leaving the Power BI ecosystem. It provides a self-service data preparation tool, which allows business users to work with enterprise data. It is no longer a data visualization tool; it has become a central part of modern data handling, analytics, and business intelligence.
Conclusion
So, Excel vs Power BI, which should you learn first? Here is a very straightforward answer for that. If you are very new to data, then you need to build your foundational skills first. Fundamentals of Excel are very important in building your professional career in Excel. Excel helps you to understand data, clean data, analyze data, and structure data in a very systematic and smooth way. If you are already aware of Excel and now you want growth in your career path, or you are looking for exposure in analytics, business intelligence, or the data engineering field, then Power BI is the right choice for you. It is more advanced and has a lot more career opportunities
If you really want to invest your precious time into learning a new skill, which one should you go for? Should you first build your foundation in Excel and then start with Power BI, or just jump-start with Power BI? The answer is completely dependent on where you are in your career at present, what kind of job you do, and where you want to see yourself in the near future.