Does data analytics require coding? Not always, but coding becomes important as you grow. Learn when coding is essential, beginner-friendly no-code tools, required skills, and how Edept prepares you for both coding and non-coding analytics roles.
Data analytics is one of the fastest-growing career paths, with industries using data to make smarter decisions, minimise risks, optimise performance, and predict trends. Whether you are binging on Netflix and get the next recommended movie, banks detecting fraud, or brands personalizing ads, data analytics is behind all. But with so many tools, technologies, and buzzwords floating around, one question dominates Google searches: “Does Data Analytics Require Coding in 2026?” The question becomes crucial for beginners, especially for those from non-technical backgrounds.
However, the truth is, you do not need heavy coding to start your data analytics career. Secondly, coding becomes an essential part of your long-term growth, deeper analysis, and higher-paying roles. In this blog, we break down every layer of this topic, starting from basic requirements to career pathways, so that you can confidently plan your journey.
Start Your Data Analytics Journey with edept – Explore Courses Now
Does Data Analytics Require Coding in 2026?
Most people imagine data analysts writing complex code all day, but the reality is more nuanced. Is coding a part of the role? Coding is one part of the role, not the whole story. Whether or not you need coding depends entirely on the type of data analysis you want to perform, the tools your company uses, and your future goals. Before we jump into the technical details, let us understand how data analytics works in real organisations in 2026.
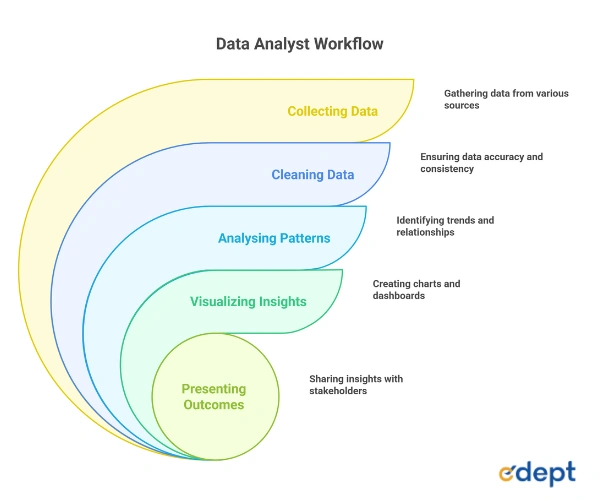
Understanding the Workflow of a Data Analyst
Coding becomes important mainly in the first two and sometimes the third stage, especially when datasets are huge and complex. Let’s check the workflow of a data analyst:
Start Your Data Analytics Journey with Edept
Learn industry tools, work on real projects, and build job-ready skills, whether you’re from a coding or non-coding background. Start →
Why is coding not mandatory to start?
Many entry-level analyst roles rely heavily on tools that do not demand strong programming skills. You can easily start analyzing data using formulas, pivot tables, and drag-and-drop dashboards. The tools mostly dependent on the early stages are:
- MS Excel
- Tableau
- Power BI
- Google Analytics
- Internal company dashboards
Coding is mostly required when the data is too large, the goal is predictive or statistical, automation is needed, or you work closely with the databases.
Why is Coding Important for Growth?
When non-coding tools let you begin your journey, they have limitations. To grow into roles such as senior analyst, data scientist, automation developer, and BI developer, coding becomes crucial for handling real-world data complexity. Some of the reports by NASSCOM and McKinsey indicate:
- 60% of analysts will require SQL by default
- 45% of analytics teams now use Python in daily workflows
- Companies prefer candidates who can work across tools, not just dashboards
Therefore, coding is not a mandatory requirement when starting your career as a data analyst, but in the long run, it is extremely crucial for growth.
Book a Free Counselling Session
Not sure if coding is right for you? Speak with Edept’s expert mentors and get personalised guidance on your analytics career path. Read →
When Does Coding Become Essential in Data Analytics?
As the beginner-friendly tools help you to understand data, coding becomes unavoidable in certain situations. Let’s check some scenarios with a detailed context and examples for a better understanding.
Scenario 1 – When Datasets Exceed Excel or BI Tool Limits
Excel and BI tools are extremely useful and powerful, but they often struggle beyond a certain data size. The moment you work with millions of rows, inconsistent data sources, or unstructured data such as logs, texts, or maybe real-time streams, coding becomes the only practical solution.
- Python can handle large datasets using Pandas and NumPy.
- SQL can extract filtered data directly from complex databases.
- Excel crashes when the file size exceeds 1–2 GB.
- BI tools depend on pre-cleaned data.
Example: E-commerce platforms create entries of millions of transactions every day. If it were your handle it manually, it would be impossible to do that. This is where SQL and Python save hours of effort and time.
Scenario 2 – When Automating Repetitive Workflows
Data analysts often perform repetitive tasks like the creation of weekly reports, cleansing data, merging files, sending dashboards, etc. Through coding, data analysts can automate these processes by freezing time and improving accuracy.
- You can schedule scripts to run daily.
- Python scripts can automate entire reports.
- SQL queries can refresh dashboards automatically.
- Automation reduces human errors.
Example: A Retail Analyst makes the correct usage of Python to automatically clean daily sales data and generate reports and updated segment-wise performance charts.
Scenario 3 – When Statistical Modelling OR Forecasting is Required
If you say basic analysis, well, it can be done without any coding. But if you say deeper analytics like forecasting future sales, understanding correlations, or clustering customer data, you will definitely require programming. Coding helps with – Time-Series Forecasting, Regression Analysis, Classification, Hypothesis Testing, and Trend Decomposition.
Example: Python’s SciPy and Scikit-learn allow data analysts to make machine learning models without crunching numbers manually.
Scenario 4 – When Working With APIs, JSON Files, or Real-Time Data
The modern analytics team uses real-time data streams from applications, websites, sensors, and marketing platforms. It is to be noted that data sources come through APIs and not Excel sheets.
- Python can fetch data via API calls.
- JSON/XML files require parsing.
- Real-time dashboards require coded pipelines.
A marketing analyst digs out data from the Facebook Ads API to monitor campaign performance every hour.
Master SQL, Python, Excel & Power BI – All in One Program
Join edept’s Data Analytics Program and become an industry-ready analyst with hands-on training and placement support.
Can You Become a Data Analyst Without Coding Skills?
Yes absolutely. Many analyst professionals start their coding career, and gradually they pick it up as their career grows. Non-technical roles in data analytics are increasing due to the evolution of user-friendly tools. Let’s understand non-coding roles in data analytics. These roles mostly focus on insights, dashboards, and decision-making, but not on any backend technical work. The tools you use here are intuitive and demand logic rather than just programming. Power BI/Tableau to visualise trends, Excel is used for decision models, Google Analytics for website data, and CRM tools for customer insights.
Common Examples of Non-Coding Analytics Job Roles
- Business Analyst
- Visualization Analyst
- Reporting Analyst
- Customer Insights Specialist
- Marketing Analyst
What are the Limitations of Avoiding Coding Completely?
Here are some of the most common constraints if you avoid coding completely in your data analytics career.
- First, you may struggle to work with a large set of data.
- Your promotions could be slower than your other data analyst mates.
- You have to rely on engineers for data extraction.
- You will never be able to switch to advanced analytics.
In conclusion, we can say that coding is not essential to begin your data analytics career, but it opens many doors in the long run.
Essential Coding Languages for Data Analysts in 2026
Below are some of the crucial coding languages for data analytics for 2026.
SQL
Structured Query Language is the most fundamental coding skill for a data professional. You can use SQL to interact with filtered data and databases and extract useful information. With the help of SQL, you can merge datasets, pull data from multiple tables, clean filters, format data, summarise insights with the help of aggregates, and write optimised queries.
Example: A financial analyst writes SQL queries to extract monthly customer transactions for churn analysis.
Python
Python is the preferred programming language for data analysis due to its powerful libraries and ease of use. It supports data cleaning through Pandas, numerical computation through NumPy, visualisation through Matplotlib and Seaborn, machine learning through Scikit-learn, and automation and scripting.
Example: A supply chain analyst uses Python to forecast demand using time series models.
R
R is widely used in research, academic, and healthcare sectors and is best for statistical testing, medical data modelling, research projects, and bioinformatics. For example, a healthcare analyst uses R to analyse clinical trial data and patient responses.
How Much Coding Do Data Analysts Actually Need?
The requirements of coding actually vary across companies, industries, and roles. Let’s break it down role-wise.
Beginner Analysts
Let us consider beginner-level data analytics with 0 to 1 years of experience.
- SQL: Basic select, join
- Python: Optional
- Focus: Understanding data and dashboards
Mid-Level Analysts
The mid-level data analysts are mostly considered to have between 1 and 3 years of experience.
- SQL: Intermediate queries
- Python: Data cleaning, automation
- Focus: Reporting + business insights
Senior Analysts
Senior analysts are
- SQL: Advanced queries
- Python: ML models, forecasting
- Focus: Strategic insights + automation
Data Scientists / BI Developers
Coding is mandatory.
No-Code and Low-Code Tools That Make Data Analysis Easier
There are tools beyond programming that make the lives of beginner-level data analysts easier, such as Excel, Power BI & Tableau, KNIME/Alteryx, and AI Tools (2026 Trend).
- Excel – It is one of the most widely used analytical tools that is globally due to its simplicity and flexibility. Excel supports Pivot Tables, Power Query, Dashboards, and Logical formulas.
- Power BI & Tableau – These tools help convert raw data into beautiful visualisations and dashboards with minimal technical skills. Power BI & Tableau assist in Drag-and-Drop Visualisation, Custom Charts, Data Modelling, and Interactive Dashboards.
- KNIME/Alteryx – Visual workflow tools that permit data transformation without code. They are useful for Automation, Blending datasets, ETL workflows, and Rapid prototyping.
- AI Tools (2026 Trend) – When we talk about AI tools, it includes Modern BI tools which contain automated insights, querying, natural language and AI-assisted visuals. Here, you can ask any questions using natural language, automated patterns, and build reports without any code.
These are perfect for beginners, but still not enough for advanced data analytics work.
How edept Helps You Build Coding + Non-Coding Analytics Skills
edept bridges the gap between industry-ready analysts and beginners. Here, you will learn to excel in advanced analytics, SQL from basics to optimization, Python for automation and modelling, Power BI/Tableau dashboards, and end-to-end projects. Other benefits include an industry-certified trainer, mock interviews, placement support, and portfolio building, along with internship opportunities. edept prepares you for both coding and non-coding analytics roles based on your career goals.
Read Latest Blogs,
| Data Analytics Course Syllabus 2025 | What is Data Analytics? |
| How to Learn Data Analytics? | What Does a Data Analyst Do? |
FAQs
1. Does data analytics require coding as beginners?
Not necessarily. Beginners can start with Excel, Power BI, Tableau, and other no-code tools. However, basic SQL and Python significantly improve your growth, employability, and ability to handle large datasets as you progress.
2. Which coding languages are most important in data analytics?
SQL is mandatory for data extraction, while Python is essential for data cleaning, automation, forecasting, and modelling. R is useful for statistical research roles. Most industry roles prefer SQL + Python as the core combination.
3. Can I get a data analyst job without coding skills?
Yes, especially in business analytics, reporting, and dashboard-focused roles. But your career growth may be limited unless you learn at least SQL and some level of Python. Non-coding roles are great to start, but coding expands your opportunities.
4. Does Data Analytics Require Coding daily?
It varies. Entry-level analysts may use 10–30% coding, mostly in SQL. Mid-level roles involve 40–60% coding, especially for automation and complex data tasks. Senior analysts and data scientists use coding extensively for modelling and optimization.
5. What tools can I use for data analysis without coding?
Excel, Power BI, Tableau, Google Data Studio, KNIME, and Alteryx allow you to analyze data visually without writing code. These are excellent for beginners, but coding becomes helpful for advanced analytics and automation.