The Big Deal About Data Analytics
Data isn’t just “the new oil” anymore. It’s the whole refinery, the distribution network, and the engine driving decisions everywhere. From your Netflix recommendations to supply chain management in global corporations, data analytics is the quiet force pulling the strings behind the scenes.
In this blog, we’re diving deep into data analytics. If you are new to AI or just have heard it mentioned, you’ll understand how it works, why it is important, and how professionals use it. In addition, we’ll look into seven basic methods that support modern data analysis.
What Exactly Is Data Analytics?
The purpose of data analytics is to understand information by analysing raw data using both science and a bit of creativity. It’s not limited to numbers—you explain them through stories, find patterns, tell the future, and organise smart choices.
Here’s a quick breakdown of how it typically works:
- Collecting: Getting information from various areas, including user behaviour, profits, social platforms, and sensors.
- Cleaning: Removing duplicates, correcting errors, and organising data into a readable format.
- Analysing: Applying statistical and computational techniques to extract insights.
- Visualising: Turning those insights into charts, dashboards, or models that are useful.
Why Everyone Is Obsessed With Data Analytics
Let’s be honest—data analytics isn’t a passing trend. It’s become mission-critical for businesses, non-profits, governments pretty much anyone who makes decisions.
Here’s why it’s such a big deal:
- Smarter Decision-Making: Gut feelings are great and all, but numbers back you up.
- Cost Savings: By identifying inefficiencies, making good use of resources can save companies a lot of money.
- Customer Insights: Try to understand customers’ needs, their desired time frame, and the reasons behind these needs.
- Market Trends: Stay ahead of the curve instead of playing catch-up.
Benefits at a glance:
- Reduces costs through optimization
- Improves forecasting and planning
- Enhances customer satisfaction
- Drives innovation through pattern recognition
- Aids in risk management and fraud detection
The Four Big Types of Data Analytics
There’s more than one flavour of data analytics, and each one serves a different purpose.
| Type | Purpose | Example Use Case |
| Descriptive | What happened? | Monthly sales reports, traffic analysis |
| Diagnostic | Why did it happen? | Root cause analysis for declining sales |
| Predictive | What might happen next? | Sales forecasting, churn prediction |
| Prescriptive | What should we do about it? | Pricing optimization, resource allocation |
Bonus types some experts mention:
- Exploratory: Just poking around to find something interesting.
- Inferential: Making assumptions about populations based on sample data.
- Causal: Understanding cause-and-effect relationships.
- Mechanistic: Pinning down exact mechanisms in systems (super niche, but cool).
Real-World Applications of Data Analytics
The following are the domains where data analytics rules everywhere
- Healthcare: Predict patient outcomes, personalize treatments, and track disease spread.
- Finance: Detect fraud, assess credit risks, and optimise investments.
- Retail: Analyse customer behaviour, manage inventory, and personalise ads.
- Manufacturing: Predict equipment failure, streamline supply chains.
- Gaming
Improve user engagement, balance game mechanics, and detect cheaters. - Sports: Track performance, manage injuries, and build better teams.
- Education: Monitor student progress, personalize learning experiences.
No matter where you look, someone’s using data to make smarter moves.
Process of Data Analytics
The process of data analytics is a well-structured approach that is used for collecting, processing, and interpreting data to generate actionable insights that guide decision-making. The entire process includes steps:
- Defining the Objective: The first step is to identify the problem or goal to make sure that the analysis is concentrated and appropriate.
- Collection of Data: Gathering the data from relevant sources, which include databases, surveys, APIs, or third-party datasets.
- Cleaning & Preparation of Data: The third step is to remove any duplicates (if any), handle missing values, and format data for consistency to assure accuracy in analysis.
- Data Exploration: Using statistical methods and visualization tools, we can easily understand patterns, correlations, and trends in the dataset that is required for data exploration.
- Data Analysis & Modeling: For processes concerning Data Analysis & Modeling, we have to apply techniques such as predictive modeling, descriptive analytics, or machine learning to extract insights.
- Data Visualization: The next step includes providing results through dashboards, charts, and interactive reports, which will help to make insights that are easily comprehensible.
- Interpretation & Decision-Making: Translation of findings into actionable recommendations for stakeholders is required for the Interpretation & Decision-Making process to be carried out.
- Monitoring & Optimization: The last step requires continuously tracking results and using the best strategies based on updated data available.
Read: How to Choose the Right Data Analytics Course
Skills Required for Data Analytics
To succeed in the data analytics domain, you need to possess certain skill sets, like analytical, technical, and soft skills, as mentioned below.
| Skill used | What is it all about? | Tools used |
| Data Visualization | To present data insights in a clear and visual format. | Matplotlib, Power BI, Seaborn, Tableau |
| Programming | Registering the scripts and automations for data processing. | R, Python, JavaScript |
| Statistical Analysis | This involves statistical methods to analyze data. | Python (SciPy, Statsmodels), R, SAS |
| Data Cleaning & Preparation | Prepares for the ability to gather, clean, and organize data for the required steps in analysis. | Excel, OpenRefine, Python (NumPy, Pandas) |
| Database Management | Querying and handling of structured and unstructured data. | SQL, MongoDB, NoSQL, PostgreSQL, MySQL |
| Machine Learning Basics | Applying Machine Learning algorithms for predictive research. | TensorFlow, Scikit-learn, PyTorch |
| Big Data Tools | To manage and analyse large datasets by using big data tools. | Spark, Databricks, Hadoop |
Power Your Journey with edept
If you’re serious about a future in data analytics but don’t know where to begin, edept is a fantastic place to start. They’re more than just a platform—they’re your learning launchpad. edept connects aspiring analysts and future data scientists with real-world and industry-aligned programs. If you already have a career or are just graduating from college, edept lets you check out the best learning routes, compare leading programs, and make wise choices about your education. It works just like getting advice from a career counsellor—but this one matches skills to roles more accurately and is up-to-date.
The 7 Basic Data Analytics Techniques
Let’s break down the foundational techniques that data pros rely on. You don’t have to master them all, but understanding what they do is a huge step forward.
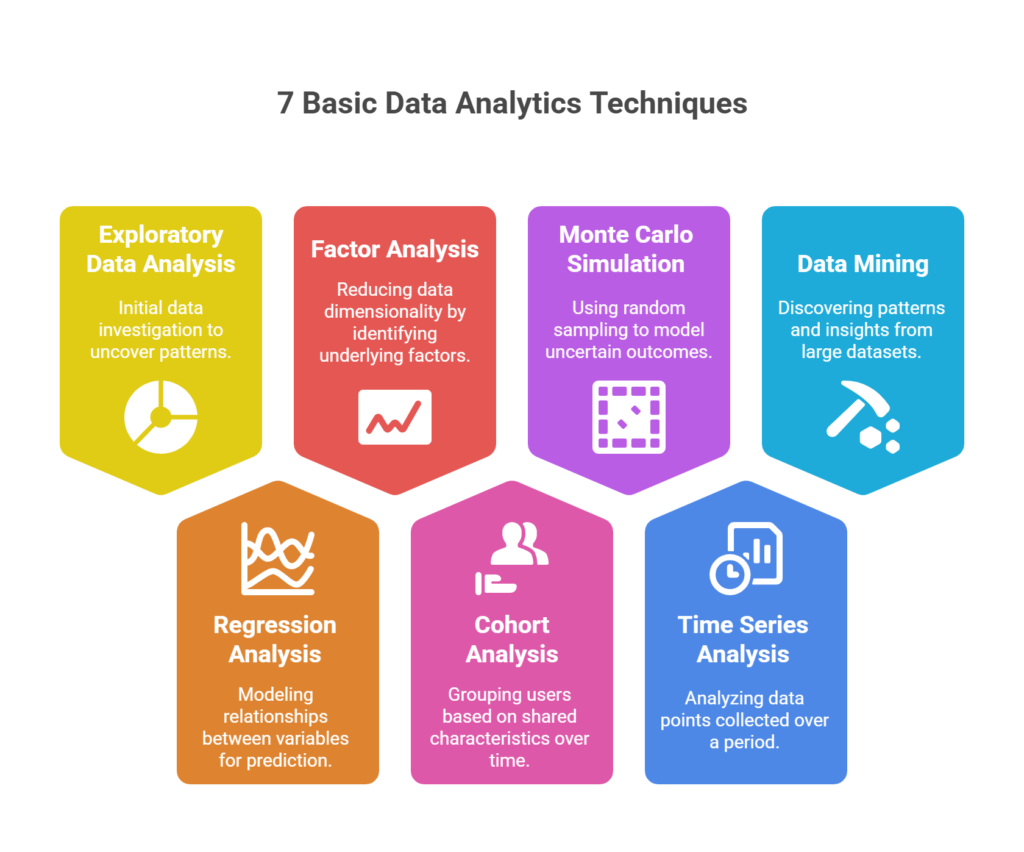
1. Exploratory Data Analysis (EDA)
This is the “getting to know you” phase with your data. Analysts look at distributions, patterns, and outliers before diving deeper.
- Tools: Histograms, scatter plots, box plots
- Use case: Finding initial insights from a new dataset
2. Regression Analysis
Used to understand relationships between variables. Like, how does advertising spend impact sales?
- Types: Linear, logistic, multivariate
- Use case: Predicting housing prices based on square footage and location
3. Factor Analysis
Dimensionality reduction at its finest. It’s used to identify underlying variables (or “factors”) that explain patterns.
- Tools: Principal Component Analysis (PCA)
- Use case: Simplifying survey results into key themes
4. Cohort Analysis
Group people based on shared characteristics and analyse behaviour over time.
- Use case: Understanding user retention by signup month
5. Monte Carlo Simulation
A fancy way to model uncertainty using random sampling.
- Use case: Simulating financial risk scenarios in investment portfolios
6. Time Series Analysis
Tracks data over time to identify trends, cycles, and seasonal patterns.
- Use case: Forecasting monthly sales or electricity demand
7. Data Mining
The art of discovering hidden patterns in massive datasets.
- Tools: Decision trees, clustering algorithms
- Use case: Fraud detection in banking
Data Analytics Techniques vs. Purpose
Check the clear distinction between data analytics techniques and purpose here
| Technique | Purpose | Common Use Case |
| Exploratory Analysis | Summarize the main aspects of the data | Initial data review |
| Regression Analysis | Find relationships between variables | Forecasting, predictions |
| Factor Analysis | Reduce variables to key factors | Market research |
| Cohort Analysis | Analyse groups over time | Customer retention |
| Monte Carlo Simulation | Model the probability of outcomes | Risk assessment |
| Time Series Analysis | Analyse data over time | Stock market trends |
| Data Mining | Discover patterns in large datasets | Fraud detection |
Also, read: Business Analytics vs Data Analytics: Which One Should You Study in 2025?
FAQs
1. What is data analytics?
Data analytics is the procedure of examining raw data to accomplish the process of discover all the ongoing trends, patterns, and insights that can inform decision-making.
2. What are the main types of data analytics?
The main types of data analytics include descriptive, diagnostic, predictive, and prescriptive analytics.
3. Why is data analytics so important?
Data analytics is crucial, as it helps businesses reduce costs, improve decisions, and understand customers better.
4. What are the common techniques used in data analytics?
The common techniques employed in the field of data analytics are exploratory analysis, regression, factor analysis, cohort analysis, time series, simulations, and data mining.
5. How is data analytics used in business?
Data analytics is used in several domains that include forecasting sales, understanding churn, optimizing pricing, and more.
6. What skills do I need to get into data analytics?
The required skill sets to master the field of data analytics include a mix of statistics, programming (Python/R), data visualization, and storytelling.
7. Which are the best must-have tools for data analytics?
Some of the must-have tools to use in data analytics are Excel, SQL, Python, R, Tableau, Power BI, and sometimes even Google Sheets.