To learn data analytics, start by building a solid foundation in statistics, Excel, and SQL to understand how data is organized and analyzed. Then, learn programming languages like Python or R and use Business Intelligence (BI) tools such as Power BI or Tableau to visualize insights. Finally, apply your knowledge through real-world projects, Kaggle competitions, and by creating a portfolio that highlights your analytical skills.
The data-driven trend today has led businesses to rely on insights to make smarter decisions, optimise processes, and create better consumer experiences. Data Analytics is one of the most in-demand career paths for students and working professionals looking for endless career opportunities. Now the main question lies: How to Learn Data Analytics Effectively? Through this blog, candidates will get to learn about the endless opportunities that can be unlocked after the completion of the Data Analytics Course. Candidates will also get a detailed idea of how to overcome the mistakes, crack different learning paths, and sketch a roadmap to a successful data analyst.
Why Learn Data Analytics?
The demand to become a data analyst is spreading worldwide. The average data analyst salary in India as of 2025 is recorded as INR 4,00,000 to INR 10,00,000 Per Annum. The range of salaries depends on the skills and experience of the candidates. Top recruiters of the Data Analytics Course are Accenture, Amazon, TCS, and many more. By learning a data analytics course, candidates can build a high-paying and future-proof career, and gain decision-making skills through insights gained. Candidates get a transition into industries like Finance, IT, Healthcare, Marketing, and e-commerce.
Common Pitfalls for Beginners
Most of the data analyst freshers struggle to learn the course details because of unavoidable mistakes. Some of these include:
- Candidates try to master all the aspects of data analytics at once.
- A major issue lies when the fundamentals of statistics and Excel are ignored.
- Learning the data analytics tools without understanding the real-life applications of the tools.
- Trying to avoid coding, as it might feel intimidating sometimes.
- Not practicing the real-life datasets available.
Different Learning Paths to Learn Data Analytics
There are multiple ways to learn data analytics, depending on the candidates’ goals. The different learning paths include self learning procedures through free resources, YouTube, and blogs. edept’s Data Analyst Courses are one of the best data analyst courses in India. Check the detailed learning paths of data analytics here.
Enroll in the Data Analyst Course by edept that covers topics like –
- Core fundamentals of analytics candidates get to learn new concepts, data collection techniques, statistical methods, and data cleansing techniques in order to build a strong base.
- Tableau and Power BI Trainings create interactive dashboards, use of DAX functions, application of advanced charting, and decision-making through the generation of real-time business intelligence reports.
- SQL helps candidates master writing complex queries, indexing, subqueries, joins, stored procedures, and optimisation methods for efficient database management.
- Python for data analytics helps in gaining hands-on experience with Pandas, Matplotlib, NumPy, and Seaborn. Candidates get to learn automation, API integration, data manipulation, and predictive analytics with the help of Python.
- Statistical and Predictive Modelling where candidates are required to comprehend probability distributions, hypothesis testing, regression analysis, and get trained in machine learning concepts for real-world applications.
- Hands-on assignments with industry datasets work on applying concepts to real projects in healthcare, finance, marketing, and e-commerce to gain practical experience.
- Certification and Career Support are required. Candidates can earn a recognised certificate to boost their resume. The data analytics course by edept helps in resume building, preparation for interviews, and deep guidance for placements that help them to land a top data analytics job in India.
- Capstone Project & Portfolio Development, where candidates get to work on an end-to-end assignment to showcase their experience in analytics, from data cleansing to storytelling and visualisation.
Read: What is Data Analytics? A Complete Guide 2025
Top Recommendations
- B.Tech in Business Analytics & Computer Science by Rishihood University, powered by edept.
- B.Sc. in Data Science by Shree LR Tiwari Degree College
- Post Graduate Program in Business Analytics by Ramaiah Institute of Management
- PGDM in Analytics, Finance, and Management by Shree LR Tiwari School of Business Management
Step-by-Step Guide to Learning Data Analytics
Check the step-by-step learning process of data analytics here:
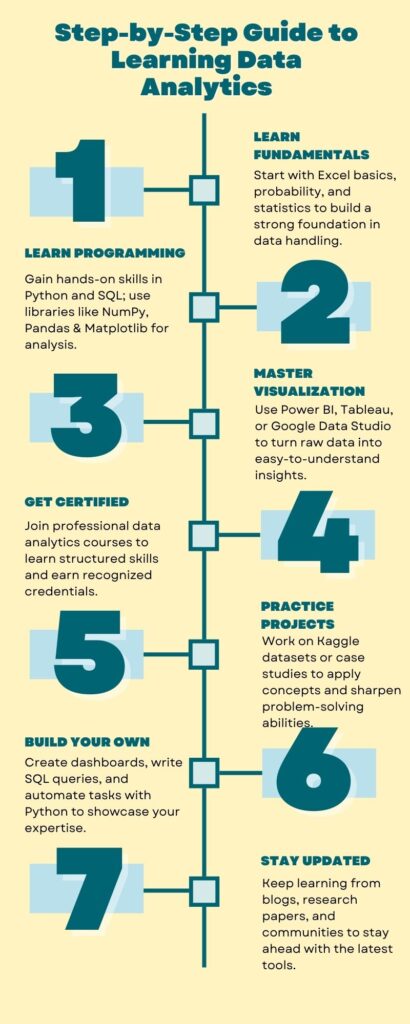
1. Learn the Fundamentals
Tools like Excel are for freshers. Candidates should begin with the basics in the first hand, which include probability, statistics, and data handling. Excel helps candidates get comfortable with functions, basic charts before moving on to advanced tools and handling pivot tables. A strong foundation in statistical analysis, covering mean, median, mode, correlation, and regression, is necessary, as having a good understanding of numbers is essential for analytics.
2. Learn Programming Languages
Python and SQL are commonly used in data analytics. Python is beginner-friendly and powerful, while Structured Query Language or commonly called SQL, is fundamental or the backbone of database administration. Python comes with libraries that contain NumPy, Pandas, Matplotlib, and Seaborn, which make data analysis, data cleaning, and visualization seamless. Almost every company across the globe stores data in relational databases for which SQL is required to extract, query, and manage the data effectively.
3. Master Data Visualization Tools
Data storytelling is necessary just like data crunching. Power BI, Tableau, or Google Data Studio are required for visualising data. Through these tools, candidates can present the insights. With the assistance of these tools, candidates can present insights virtually to be accessible to the decision makers.
4. Seek Courses and Certifications
edept’s Data Analytics Certification course ensures candidates stay on track and get recognised credentials. edept’s Data Analytics Certification Course covers SQL, Python, Power BI, Tableau, statistics, and hands-on projects, assisting candidates in building both technical skills and an exceptional portfolio.
5. Practice with Real-World Projects
Kaggle, UCI Machine Learning Repository, or company case studies are required. Candidates can download datasets and apply them to enhance their skills. By working on these projects, candidates can gain experience in cleaning clumsy datasets, applying statistical models, and deriving actionable insights. The more projects candidates work on, it becomes better in adopting problem-solving skills.
6. Building Own Projects
Creation of own dashboards is required, which can sometimes be in the form of analysis reports. This helps in building a strong portfolio to impress the recruiters.
- Design dashboards on Tableau or Power BI that are interactive.
- Start writing SQL queries to analyse any open source datasets.
- Use Python to automate data cleaning or build uncomplicated predictive models.
- Candidates should start sharing these projects on LinkedIn, GitHub, or in the form of personal blogs that help in showcasing their expertise to the HRs and Managers.
7. Stay Updated
In data analytics, it is essential to stay constantly updated with the recent developments, which come in the form of research papers, Kaggle discussions, blogs, LinkedIn groups, and community forums. Candidates should never stop experimenting with the most delinquent components of Tableau, Power BI, and Python libraries.
Conclusion
Understanding data analytics is a journey. A journey that requires consistency, patience, right guidance, and practice. The sector is surrounded by enormous demand for skilled data professionals, which is rising day by day. Whether it is the beginning or the condition lies in the upgradation of skills, choosing edept’s data analytics course becomes the right choice to blend theory, tools, and projects.
Also, read: Data Analytics Course Syllabus 2025: Everything You Need to Know
FAQs
1. How should I start learning data analytics?
First, you have to start with statistics, Excel, and the basics covering data handling basics, then proceed with Python, SQL, and visualization tools.
2. What are the steps of learning data analytics?
The steps in learning data analytics are Fundamentals, followed by Programming, Visualisation, Real projects, certification, and portfolio.
3. Does data analytics require coding?
Yes, data analytics requires coding. Basic coding in Python and SQL will be required. It is quite beginner-friendly; there won’t be many problems in learning the course.
4. Is Python compulsory for data analytics?
Python is compulsory for its simplicity and powerful libraries. However, other tools like R and SQL are also essential.
5. What is the salary of a data analyst in India?
The average entry-level data analyst salary starts from INR 4LPA to INR 6 LPA, which can extend to INR 10 LPA or more.
6. How long does it take to learn data analytics?
The time required to learn data analytics is not constant. It is an ever-evolving subject that comes with continuous updates. However, according to top institutes offering data analytics courses, the fundamentals typically require 4 to 6 months to complete and make one job-ready within a year.