The Data Analyst Course Syllabus 2025 covers core subjects like statistics, SQL, Python, and data visualization tools, along with hands-on projects. It equips learners with the latest technical and analytical skills needed to start or advance a career in data analytics.
Data Analytics Course Syllabus contains topics and exercises that equip you with the ideas of how to extract, interpret, and manage data to draw conclusions or understandings. In today’s data-driven world, data analytics plays a vital role in building a sought-after career. Whether you are looking to upskill or are an aspiring analyst, it is crucial for you to understand the data analytics syllabus to choose the right program.
Data Analytics core subjects include data collection, data structures and algorithms, probability and statistics, data simulation, etc. The important data analytics subjects include data analytics, Excel, statistical analysis, SQL, Power BI, Tableau, etc. In this blog topic, you will learn about the core subjects, elective subjects, tools, and techniques, along with other topics that you will encounter while going through the course.
What is a Data Analytics Course?
The Data Analytics Program is a structured learning course that prepares you with the skills to analyze, process, collect, and interpret data to make informed business decisions. The Data Analytics Course Syllabus incorporates theory and hands-on practice, which assists you in understanding how to work with statistical techniques, data tools, and visualization platforms.
Semester-wise Data Analytics Syllabus 2025
Check the semester-wise Data Analytics Course Syllabus below.
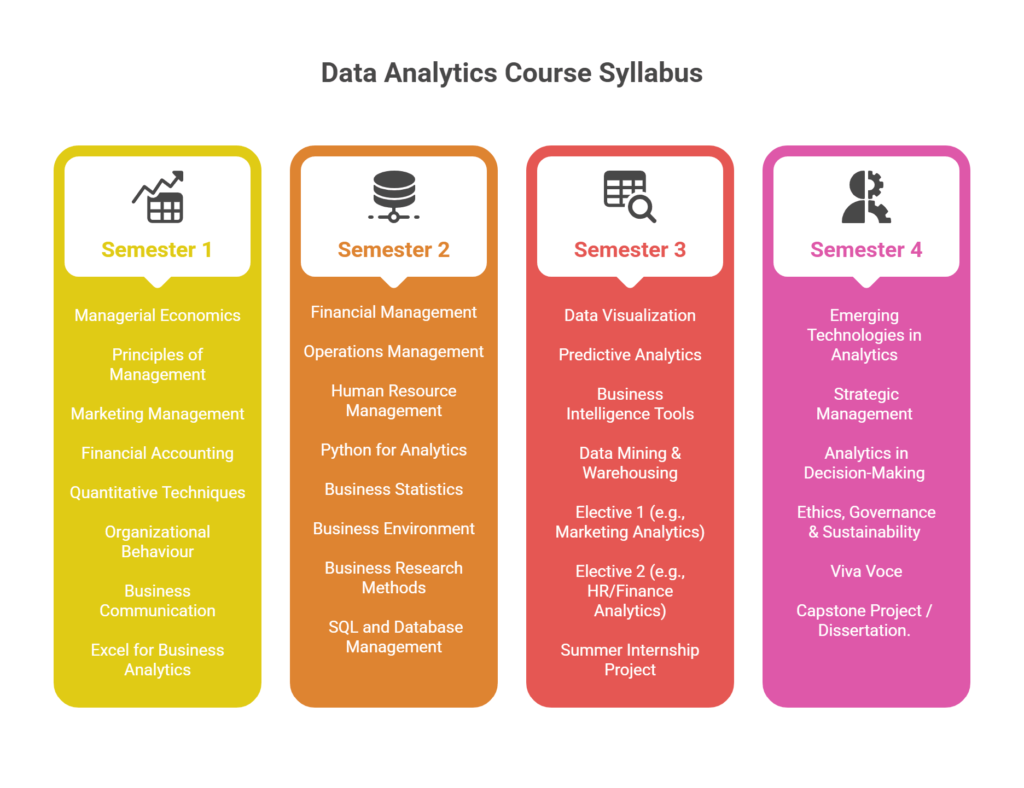
Semester 1
| Data Analytics Semester 1 Subjects | What is the focus of this subject? |
| Managerial Economics | Micro & macroeconomic decision-making |
| Principles of Management | Fundamentals of business and organizational operations |
| Marketing Management | Market Segmentation, Consumer Behavior, 4Ps |
| Financial Accounting | Accounting concepts, ledgers, and balance sheets |
| Quantitative Techniques | Statistics, Probability, and Linear Programming |
| Organizational Behaviour | Human behavior in organizations |
| Business Communication | Verbal and written communication for managers |
| Excel for Business Analytics | Dashboards, Basics of MS Excel, Charts |
Semester 2
| Data Analytics Semester 2 Subjects | What is the focus of this subject? |
| Financial Management | Time value of money, capital budgeting, cost of capital |
| Operations Management | Inventory, supply chain, lean manufacturing |
| Human Resource Management | Recruitment, performance appraisal, and labor laws |
| Python for Analytics | Data manipulation using Pandas, NumPy, and basic visualization |
| Business Statistics | Descriptive and inferential statistics |
| Business Environment | Indian and global business scenario and policies |
| Business Research Methods | Research design, sampling, data analysis |
| SQL and Database Management | Query writing, database design, relational models |
Semester 3
| Data Analytics Semester 3 Subjects | What is the focus of this subject? |
| Data Visualization | Tableau / Power BI for building dashboards |
| Predictive Analytics | Regression, forecasting models, classification |
| Business Intelligence Tools | Real-time decision support systems |
| Data Mining & Warehousing | Association rules, clustering, OLAP, ETL |
| Elective 1 (e.g., Marketing Analytics) | Domain-specific analytics skills |
| Elective 2 (e.g., HR/Finance Analytics) | Tailored functional analytics modules |
| Summer Internship Project (SIP) | Industry-based internship with report & presentation |
Semester 4
| Data Analytics Semester 4 Subjects | What is the focus of this subject? |
| Emerging Technologies in Analytics | Artificial Intelligence and Machine Learning, Big Data overview, Internet of Things |
| Strategic Management | Business strategy formulation and implementation |
| Analytics in Decision-Making | Real-life decision modeling and simulations |
| Ethics, Governance & Sustainability | Corporate governance and data ethics |
| Viva Voce | Oral presentation and defense of the final project |
| Capstone Project / Dissertation | Live industry project with analytical insights |
Read more: Data Analytics Course: Fees, Benefits, Applications, and Insights
Skills Developed Through a Data Analytics Course
You’ll possess various useful and technical skills at the end of the course. Some of the most important abilities you’ll learn are:
- Turning raw data into a format that can be managed and analysed is one of the important changes.
- Using statistical analysis to make sense of the information.
- Showing data with helpful charts and graphs to make insights easy to see.
- Forecasting with Machine Learning: Making predictions for future events with machine learning.
- Problem-Solving: The ability to study large amounts of data and draw conclusions on courses of action.
Tools and Technologies Covered in the Data Analyst Syllabus
Tools and Technologies That You Need to Know from the Data Analyst Syllabus, along with theory, a detailed data analytics course will introduce you to various tools and systems that data analysts depend on each day. The following tools are among those most frequently mentioned:
- Excel is commonly used as a first step in analysis, since it lets you simply work with and see data.
- SQL is the usual language for working with databases and performing queries.
- Python is an effective programming language that includes useful libraries such as Pandas and NumPy for examining data.
- Tableau helps you create dashboards that are easy to interact with and share online.
- Many people also use R mainly for data analysis work in education and science.
Read more: What is Data Analytics? A Complete Guide 2025
How to Get Started as a Data Analyst?
To start your career as a data analyst, you have to be ready for an assortment of practical applications, technical learning, and strategic planning. To get the detailed roadmap of how to get started as a data analyst, check below.
- Build a strong base in Excel, SQL, and statistics.
- Give more time to understanding core subjects like data types, cleaning, and exploration.
- Enroll in a budget-friendly data analysis course.
- You have to learn programming languages and tools like Python or R for data manipulation and analysis.
- Practice with real-time data using top platforms like Google Dataset Search, Kaggle, or GitHub.
- Try solving data sets related to finance, retail, or healthcare.
- Aim for building a solid portfolio of 2 to 4 projects with EDA, dashboards, and visual storytelling, and upload it to GITHUB or make a personal LinkedIn post.
- Earn industry-valued certificates like the Google Data Analytics Professional Certificate, Microsoft, or IBM Data Analyst Certificate.
Career Opportunities After Completing the Data Analytics Course Syllabus
Earning a data analytics credential can lead you to many job opportunities. Possible job roles in this field are:
- Data Analyst: A data analyst’s role is to examine data to help businesses make important decisions.
- Business Intelligence Analyst: Gathering and studying business data to boost a company’s achievements.
- Data Scientist: Working with machine learning, a data scientist deals with vast datasets to create predictions and advise.
- Data Engineer: Developing and taking care of the systems used for data storage and processing.
- Quantitative Analyst: Analyzing financial data using statistics to help shape various investing options.
How to Choose the Right Data Analytics Course Syllabus
Keep in mind a few aspects before taking any data analytics course to make sure it fits with your career goals.
- Course Content: Check that the syllabus explains working with data, using statistics, and the basics of machine learning.
- Tools and Technologies: Check if the course includes training in the important tools and technologies common in the industry. Review the curriculum to confirm you’ll be taught about the general tools and technologies employed in the industry.
- Duration and Flexibility: Know if the amount of time spent on coursework fits your schedule.
- Industry Connections: Adding work experience with companies or internships makes your resume stronger.
Where to Learn: Why edept Stands Out
If you’re ready to turn curiosity into a career, edept offers one of the most industry-aligned data analytics programs available today. In partnership with leading institutions like Shree L.R. Tiwari School of Business Management, Edept delivers a curriculum that blends technical expertise with real-world business applications.
From hands-on training in Python, SQL, Tableau, and Power BI to mentorship from industry pros and global exposure through international immersions, edept is more than a course provider. It’s your launchpad into the world of data analytics.
Conclusion
In summary, getting familiar with the syllabus of a data analytics course should be your priority before starting anything. You’ll quickly learn about all the skills and knowledge you’ll need and how they will benefit you later in your career. To become successful as a data analyst, you should study both theory and application. Be sure to compare each syllabus early in the enrollment process, since this will affect your future career.